Evaluating the 2022 US News Law School Rankings on its Own Terms
US News Rankings versus US News Data
Last week marked the annual tradition of lawyers and law students eagerly reviewing the newest release of the US News Law School Rankings. There are many reasons to question the validity and reliability of US News’s yearly quantitative assessments of law schools. But my purpose here is not to rehash all of those legitimate concerns and questions.
Instead, my goal is to review the publicly available data that US News provides and demonstrate how the methods used by the former magazine to calculate, aggregate, and combine that data are often problematic and misleading. The primary issues that I identify and explore with regard to US News’s ranking system are:
Using non-public data;
Masking the distribution of the data;
Creating metrics that do not validly reflect what they seek to measure; and
Assigning ordinal ranks that likely do not describe differences between schools.
As part of my examination of those concerns, I recalculate the rankings and scores of schools without repeating US News’s mistakes. In an effort to make my calculations and visualizations completely transparent, I have made the code available for all of them available on GitHub.1 If anyone, including US News, finds a mistake in my analysis, please let me know and I will correct it ASAP.
Hidden Data
There are several ways that US News withholds data from its readers. First, its ranking system relies on unaudited, non-public data for at least 11.75% of its overall scoring system. These data consist of two separate categories of law school expenditures (which ultimately reward schools with higher tuition) and law library resources. Second, US News does not list the medians for the LSAT scores and undergraduate GPAs of the entering class which it uses for scoring schools (although you may get that data from other sources).2 Instead, it provides the 25th and 75th percentiles of those categories, allowing readers to infer an approximate median LSAT and undergraduate GPA. Third, there are also some schools, exclusively lower-ranked, which do not provide certain data to US News, which has refused to explain how it calculates a score with missing data. This raises separate validity concerns about the rankings of such schools. Fourth, for unranked schools, US News does not include its calculated total score, presumedly to prevent a reader from determining the actual rankings of those “unranked” schools. Due to the last two “hidden data” issues, I limit some of my analysis in this article to the schools with complete public data, including US News scores.3
Any rankings system that has the level of influence as US News’s should certainly make such data available so that readers can assess its accuracy and effects. That US News chooses not to do so raises suspicions about the quality of the hidden data - concerns which some of those who have viewed the non-public have corroborated. This does not mean that US News has to reveal its “secret sauce” or ruin its competitive advantage. Market dominance should not come from withholding data but from the creation and aggregation of the data itself. No entity can replace US News peer and practitioner surveys. Annually, law schools answer all of the questions that it asks. Withholding the results of those surveys only protects suspect data and potential subterfuge by law schools. And law schools have proven themselves far from innocent actors in trying to manipulate the rankings.
Nonetheless, the publicly available data provides a reasonable approximation of the law school rankings in the upper-tier. However, outside of the highest-ranked schools, my calculated rankings using US News’s vaguely described methods show that the public data rankings can vary substantially from the actual US News rank. The chart below demonstrates a significant spread in actual rank versus rank based on public data for schools outside of the top-25.
Data Scaling
Across any sample or population, data can be distributed in a variety of manners. Most commonly, the normal (“bell curve”) distribution describes a great many datasets of a particular type. US News forces its underlying data into a normal distribution even if the actual data exhibits a different distribution. US News describes its process as follows:
As you can see from the plots below of the density of different component scores across a range, this standardization process yields very different data distributions than the original data. The chart on the left shows the approximate distribution of the original data and the chart on the right illustrates the distribution after standardization.
As should be clear from the tables near the end of this article, the effects of US News’s standardization are not as significant as those graphs might indicate. This is likely because the standardization effects across each component of the final ranking counteract each other and/or do not create a significant variance overall. The largest effects of standardization helping or hurting a school were both 4 ranking spots, with a plurality of schools exhibiting no ranking skew as a result of standardization.
Fortunately, there is an easy way to avoid this problem: simply scale each category using percentages instead of standardizing them. The highest score in a category is assigned 1, the lowest score is assigned 0 and all values in between are scaled accordingly. This very basic method maintains the distribution of the data instead of artificially flattening it. There are legitimate reasons for standardizing data for certain types of analysis. However, none of those situations seems applicable to the US News rankings. For each school in the dataset, I have calculated a “percent” score and rank, using US News’ weightings, fairly and accurately aggregates and combines the US News data. Those scores and ranks are discussed later in the article.
Questionable Metrics
Amongst the public data categories, several measurements stand out as raising obvious, substantial data validity concerns: bar passage, acceptance rate, percentage of students with a loan, student/faculty ratio, and employment at graduation. At first blush, each of those categories would seem to illustrate a concept tied to overall school quality. However, the way that US News has constructed each of those metrics is problematic.
Bar passage is likely the most misleading to prospective students. This is how US News describes its process for calculating a bar passage ratio (it is not the school’s actual bar passage percentage).
This means the ratio used may only reflect a minority of students who take the bar at a school. Yale Law, for instance, has its bar passage ratio calculated from the New York bar but there is no indication how many graduates from Yale actually took the New York bar (we only know that a plurality of students did). My own law school, the University of Kansas School of Law, often alternates between being evaluated versus takers of the Missouri and Kansas bars. Rarely, however, does that ratio incorporate a majority of our bar takers. And, importantly, at many schools, the state where most students sit for the bar is not a random sample of the schools’ graduates. Often, there are clear patterns where the highest-ranked students flock to one jurisdiction and the rest of the graduating class goes elsewhere. US News makes no attempt to account for these often substantial skews.
Further, by using a ratio between a school’s passage rate in a state and the overall passage rate, the metric created by US News often better reflects the quality of other law schools in the state than the school being measured. Take, for example, the University of Nebraska and Creighton University, the two universities with law schools in Nebraska.4 Those schools likely account for the majority of bar-takers in the state. Nebraska graduates currently pass the Nebraska bar at an impressive rate of 89.4%, according to the latest rankings. It is unlikely that it can increase that rate further as it has likely hit a ceiling for first-time takers based on the results of similarly situated schools. Creighton graduates passed the bar 80% of the time on the first try. The only likely way for Nebraska to increase its bar passage score (which US News does not actually reveal) is for Creighton graduates to do worse. Similarly, Creighton, which has a high bar passage rate for schools ranked around it, needs to hope that Nebraska takers fail at a higher rate for it to climb higher. This pattern is particularly pernicious in states with fewer law schools that have higher percentages of bar takers.
The use of the bar score ratio is largely inexcusable given the other ways that the same concept can be measured. US News is relying on the ABA’s employment data which divides JD-required jobs from those that are JD-preferred. Using the 10-month employment data for JD-required jobs better reflects overall bar passage than the bizarre method US News has chosen. Further, now that over half of the states use, at least in part, the Uniform Bar Exam, there is no reason to treat states as islands. It would be preferable to group UBE states, adjust for different passage scores, and calculate an estimated bar passage number for each school. Measuring bar passage is important - it is often the ticket to the future for a law school graduate - but US News’s method for doing that is highly problematic.
Rather than taking a deep dive into each of the other questionable metrics that I have listed, let me offer a brief summary of the problems with each. Acceptance rate ignores that most law schools are regional/local (which means the decision to apply has less to do with the quality of the school than the interest in the nearby legal markets) and is frequently gamed by law schools by encouraging fee-waived applications from students that will not attend or be accepted. Student/faculty ratio might be valuable if US News provided a clearer standard for who counts as a faculty member and accounted for how often that person taught during the measured period. Employment at graduation does not account for the reality that many legal markets only make conditional offers based on bar passage and seems too loosely correlated with employment after 10 months of graduation to be considered a valuable measure of overall employment opportunities. As for the percentage of students with loans, I will defer to Derek Muller’s recent post on the subject.
In the final major section of this article, the “core” scores and ranks were calculated by excluding the above metrics of questionable quality.
Ordinal Ranking
Another significant defect of the US News Rankings system is hidden in plain sight: the use of ordinal ranking. Ordinal ranking is based on the relative scores of the items being evaluated: 1st, 2nd, 3rd, etc. Americans love ordinal ranking and clear divisions between people or items being evaluated. But they are simply inappropriate in some situations. Readers of the rankings often presume that an incremental difference in a school’s ranking measures something real about that school. If a school dropped from 14th to 15th, social media and legal publications would treat it as the most significant news story of the day (or month).
Consider a simpler case, where we ranking schools wholly on the basis of the median undergraduate GPA of just four hypothetical law schools.
A: 3.8
B: 3.78
C: 3.77
D: 2.9
Using ordinal ranking to score each school would mean that A is given a value of 1, B: 2, C: 3, and D: 4. This means that the difference between C and D is treated as equivalent to the differences between A and B as well as B and C. Further, the difference between A and C is treated as twice as large as the difference between C and D, which is methodologically unjustified and horribly misleading.
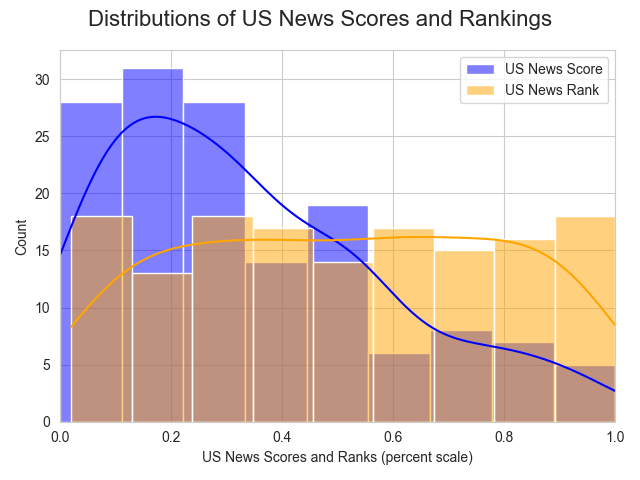
Yet, the underlying scores computed by US News illustrate that assume a flat distribution (where each drop in ranking is equivalent) are unsupported by the data and methods used. The figure below shows the distribution of US News Scores, calculated from public data for the schools in the dataset, against the flat distribution of the rankings.5 Blue corresponds to the US News Scores and orange marks the rankings, when both are put onto a common scale. Whereas the rankings indicate a flat distribution of law-school quality, the scores show a descending tail where the differences between scores at the high-end is, on average, much greater than below the 50th percentile.
Recalculating US News Scores and Rankings
Based on the issues raised above, I have created three alternate scores and ranks:
“Percent,” which use percent scaling instead of standardization;
“Core,” based on the higher-quality data categories; and
“Public,” using US News methods and weights on the public data.
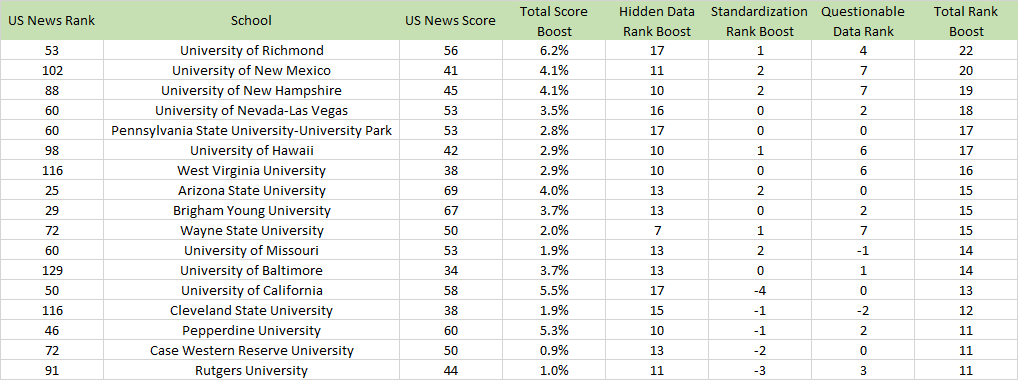
The tables below illustrate how these alternate methods of calculating the US News Law School Rankings using its public data yield very different results. Even though I have lamented the use of ordinal rankings above, I recognize the market preference for them. These are the schools that increased their ranking by at least 10 places based on the dubious methods of US News.
And these are the schools that lost at least 10 places in the rankings because of those same methodological choices.
In both charts, you can see that the magnitude of the change in score does not perfectly align with the change in rankings. This illustrates how clustering in ordinal rankings creates very different results (and why ordinal rankings should not be the central focus). Some schools with lesser score changes still suffer or benefit substantially in their rankings because of the relative proximity of the scores of other schools.
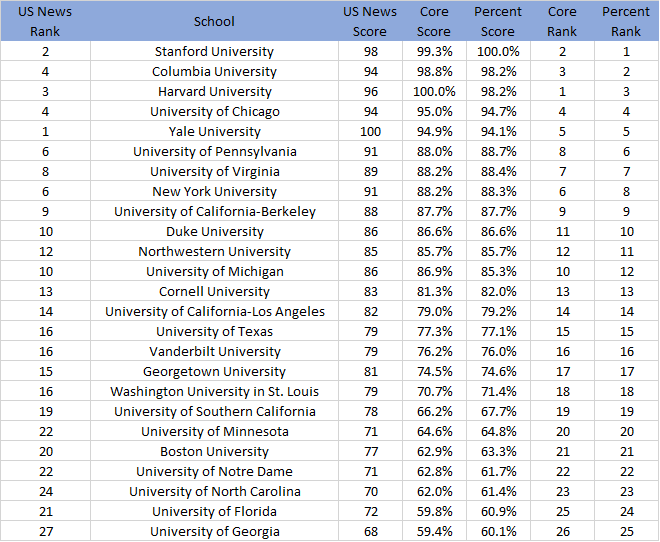
Lastly, you can see, even in the top 25 schools, which were less affected by US News techniques and data, there were some changes. Yale University, in particular, seems to benefit enormously from the non-public data.6
If you want to see how all of the schools benefit or suffer under the questionable methods that US News uses in its law school rankings, you can find the complete data here.
In order to use the package, you just need to have the necessary imported dependencies, the data provided by US News (converted to csv file to avoid an Excel import bug in pandas), adjust the file paths and folders at the top of remix.py, and run that module. I might provide further documentation in the future, but the analysis in this series is less than 350 lines in python (most of which is boilerplate and cleaning the messy US News data).
To stay true to using the public US News data, I estimate the median for LSAT and undergraduate GPA by calculating the mean average of the 25th and 75th percentile for each category of data.
The University of Tulsa, tied for 111th ranked, is the highest-ranked school that did not provide LSAT or undergraduate GPA data. There are numerous other schools below that rank that also did not provide complete data. As a result, in making comparisons between ordinal rankings in this article, I calculated an adjusted US News rank which drops schools with incomplete data.
That I picked these two schools should not be taken as a reflection on either. I just wanted a simple example to illustrate the problems associated with US News’s bar passage ratio.
Before I am accused of having an anti-Yale bias, several years ago I created an alternative law school ratings system that found Yale graduates have such better outcomes than every other law school that it deserved its own category. This result merely reflects the US News public data and how the hidden data changes the overall rankings.
Before I am accused of having an anti-Yale bias, several years ago I created an alternative law school ratings system that found Yale graduates have such better outcomes than every other law school that it deserved its own category. This result merely reflects the US News public data and how the hidden data changes the overall rankings.


